Research Library

    Browse our complete collection of reports, benchmarks, and advisory publications.

    36 reports

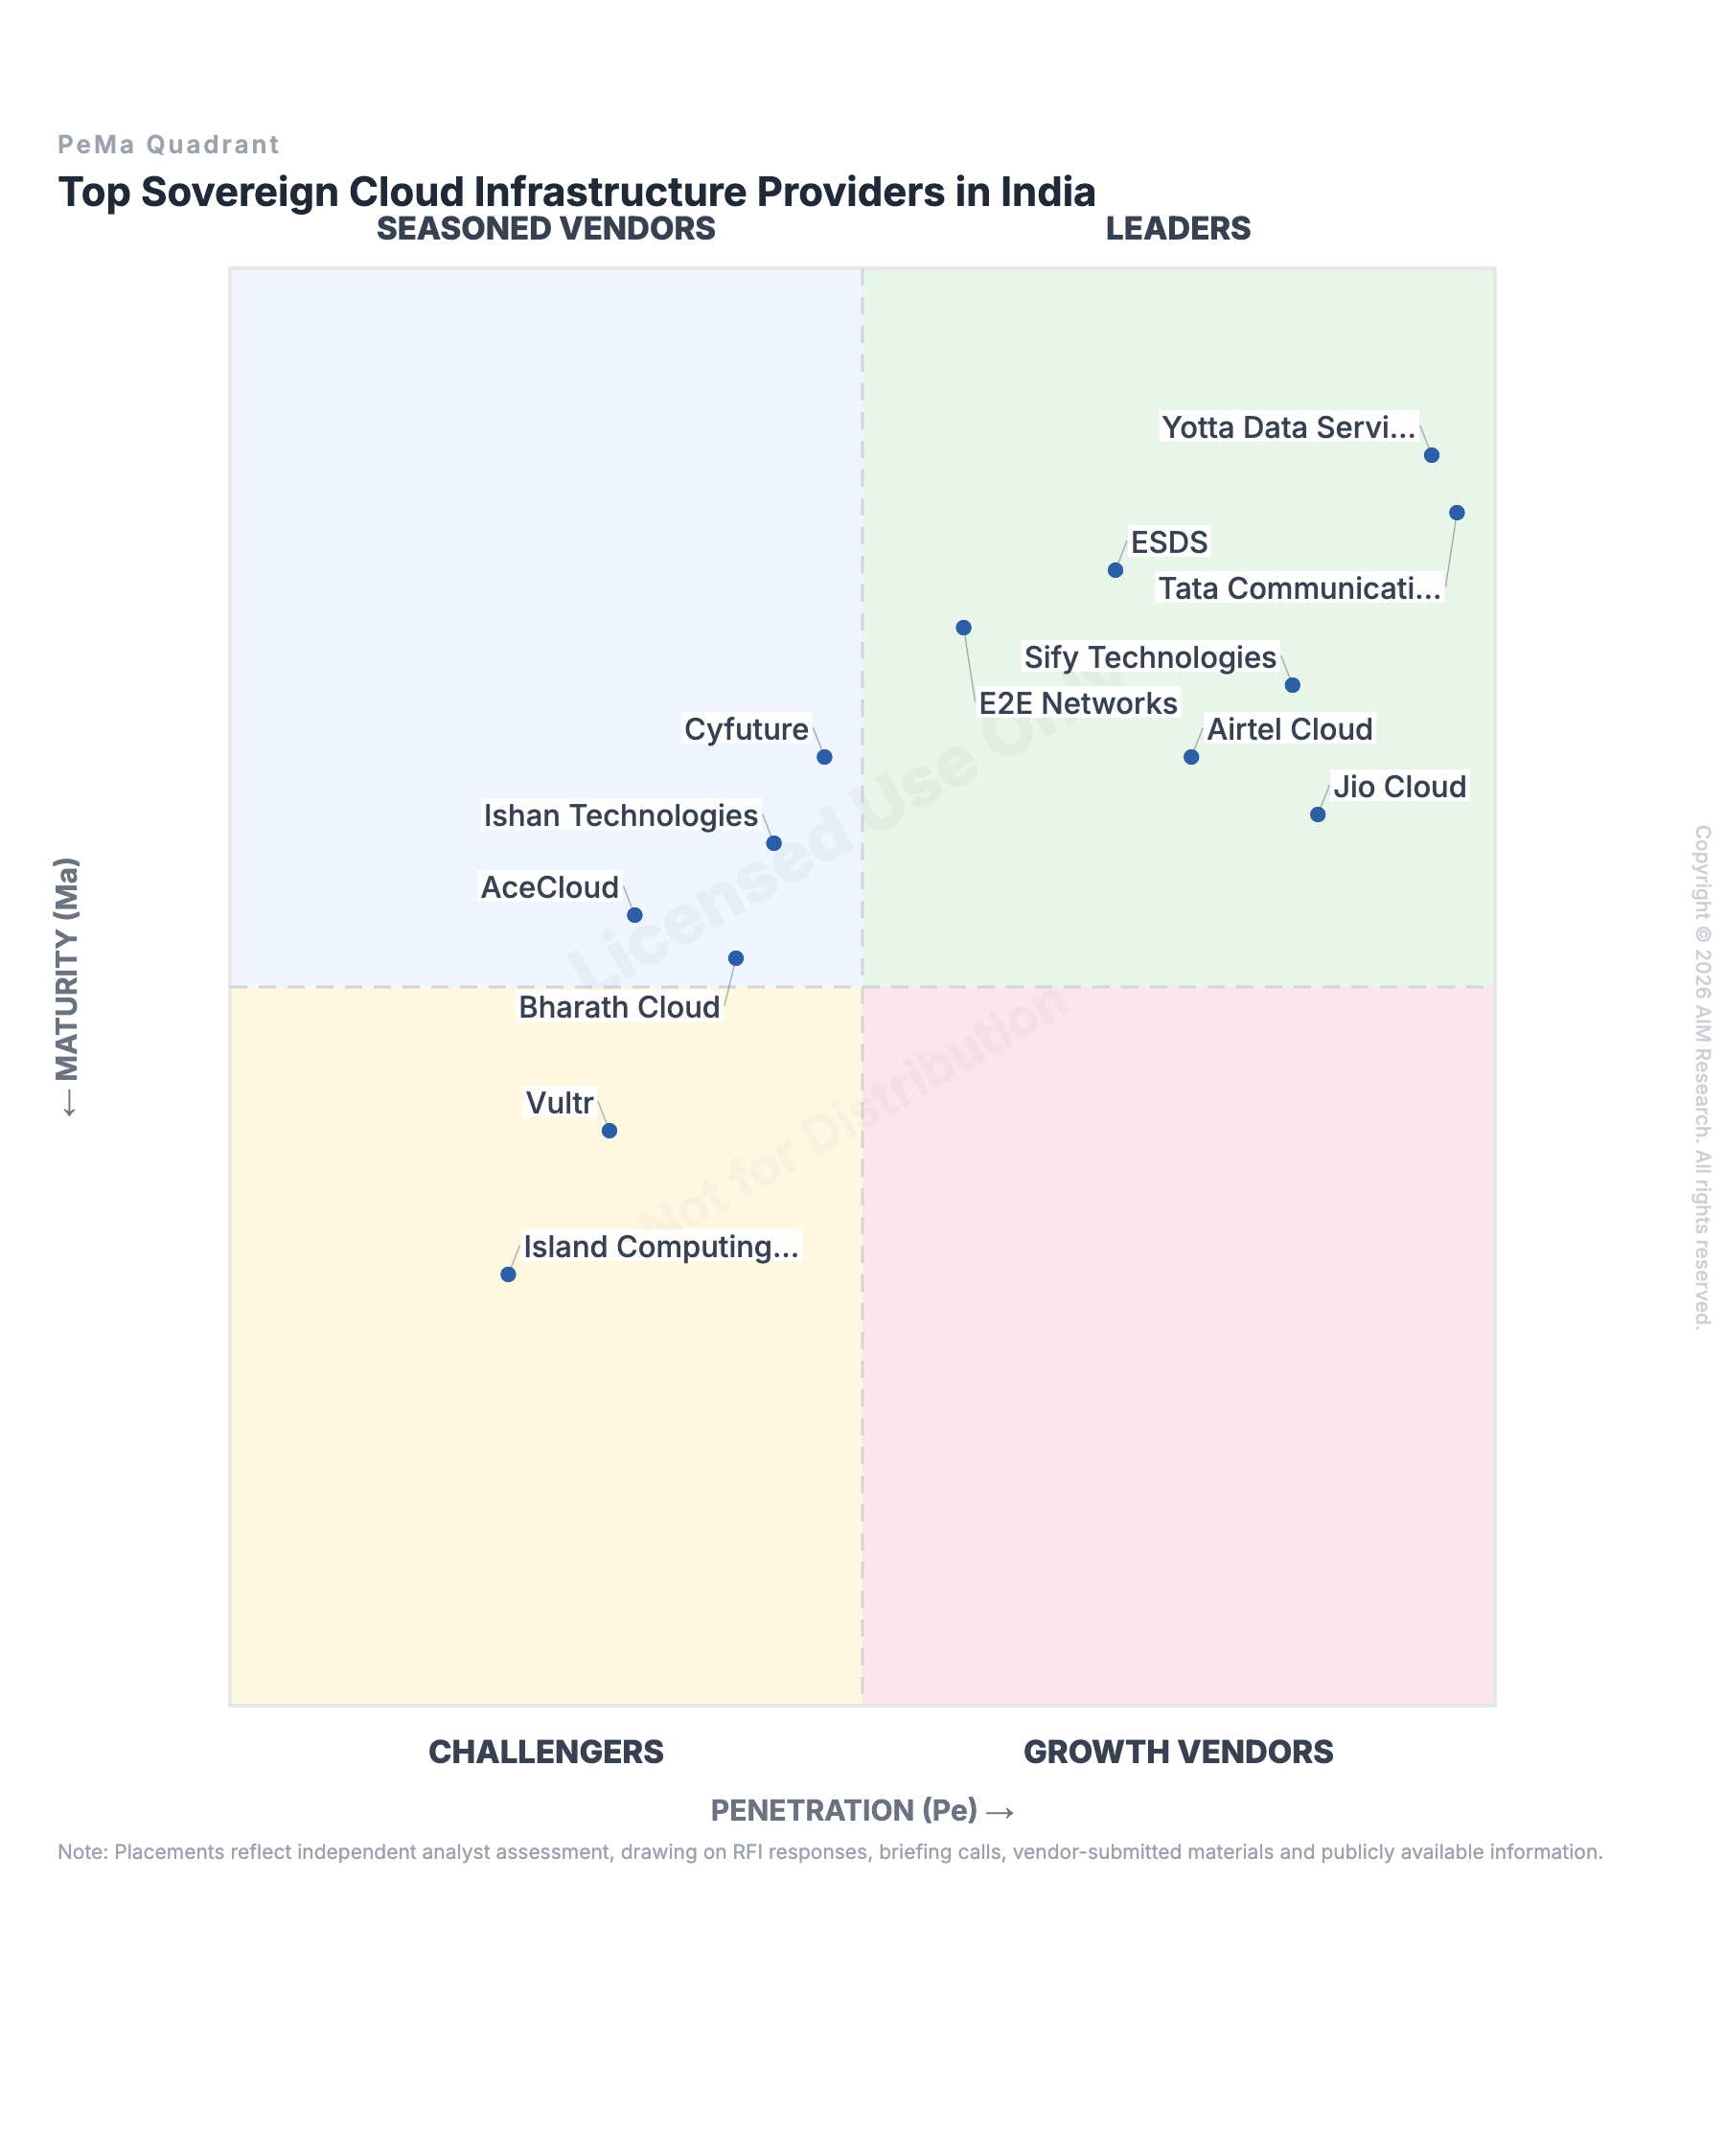
    PeMa Quadrant

    14
    Top Data + AI Platform Providers PeMa Quadrant 2026 — PeMa Quadrant cover
    PeMa QuadrantAug 2026

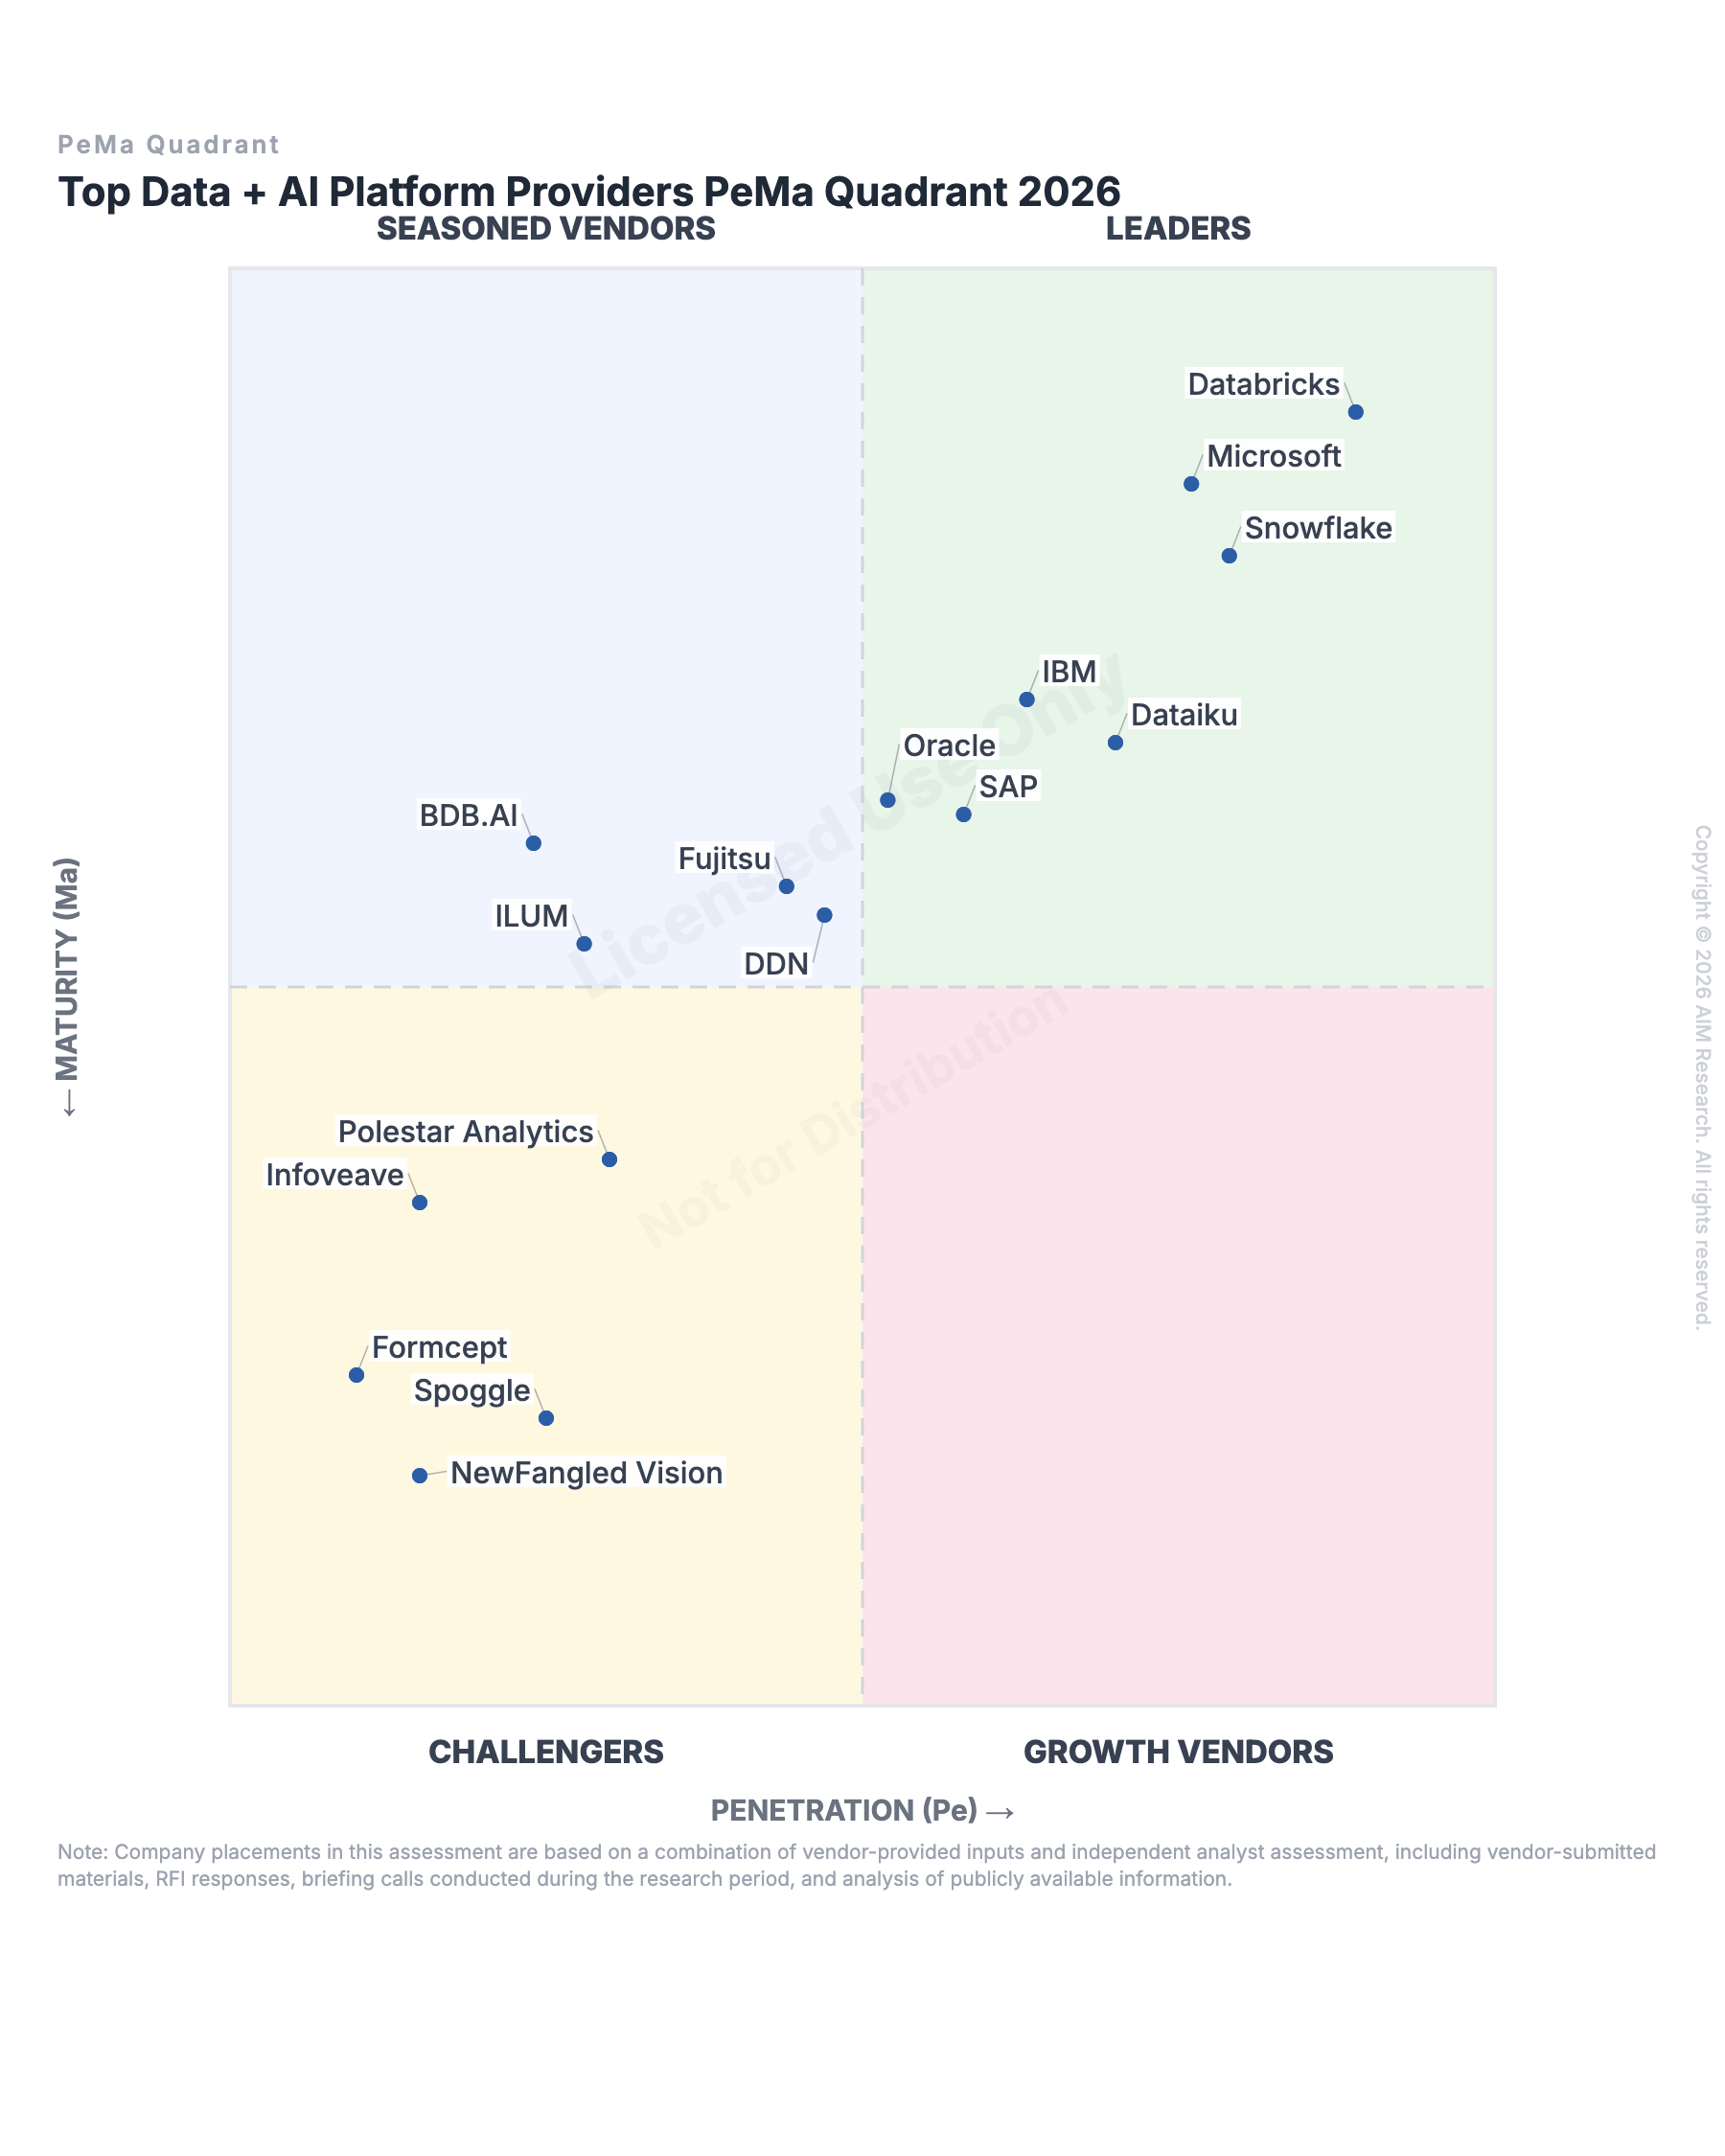
    Top Data + AI Platform Providers PeMa Quadrant 2026

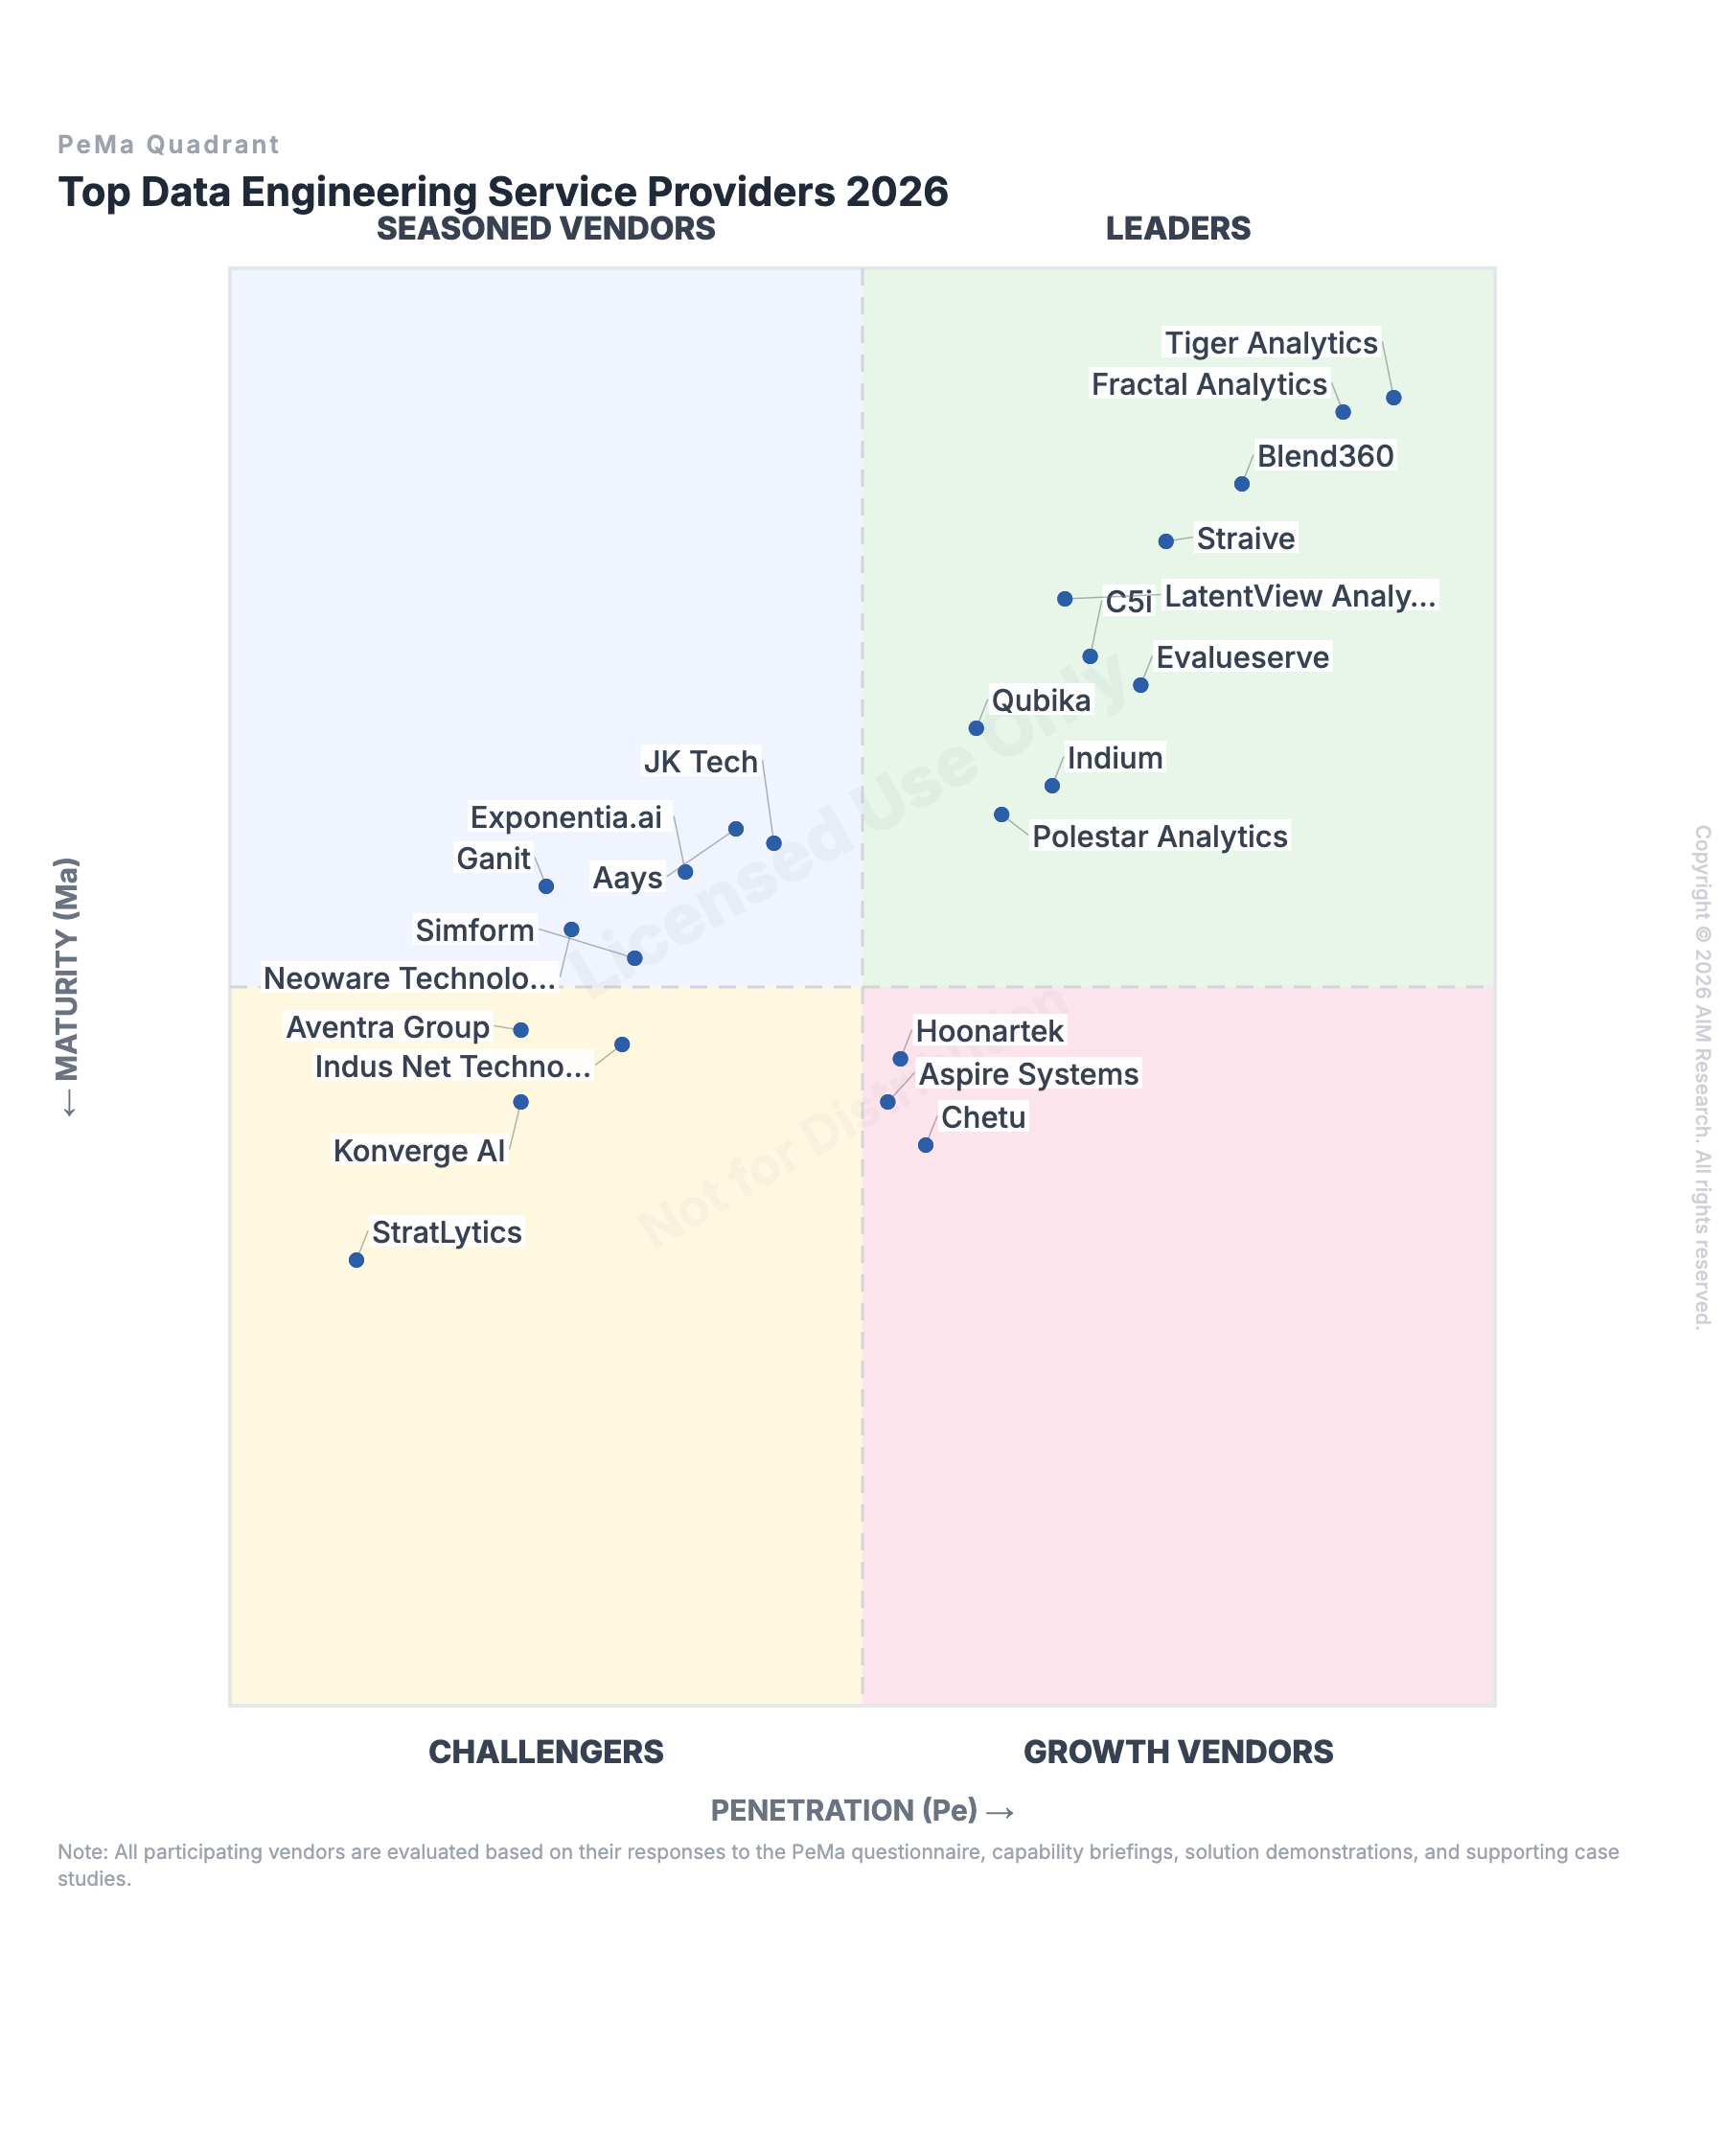
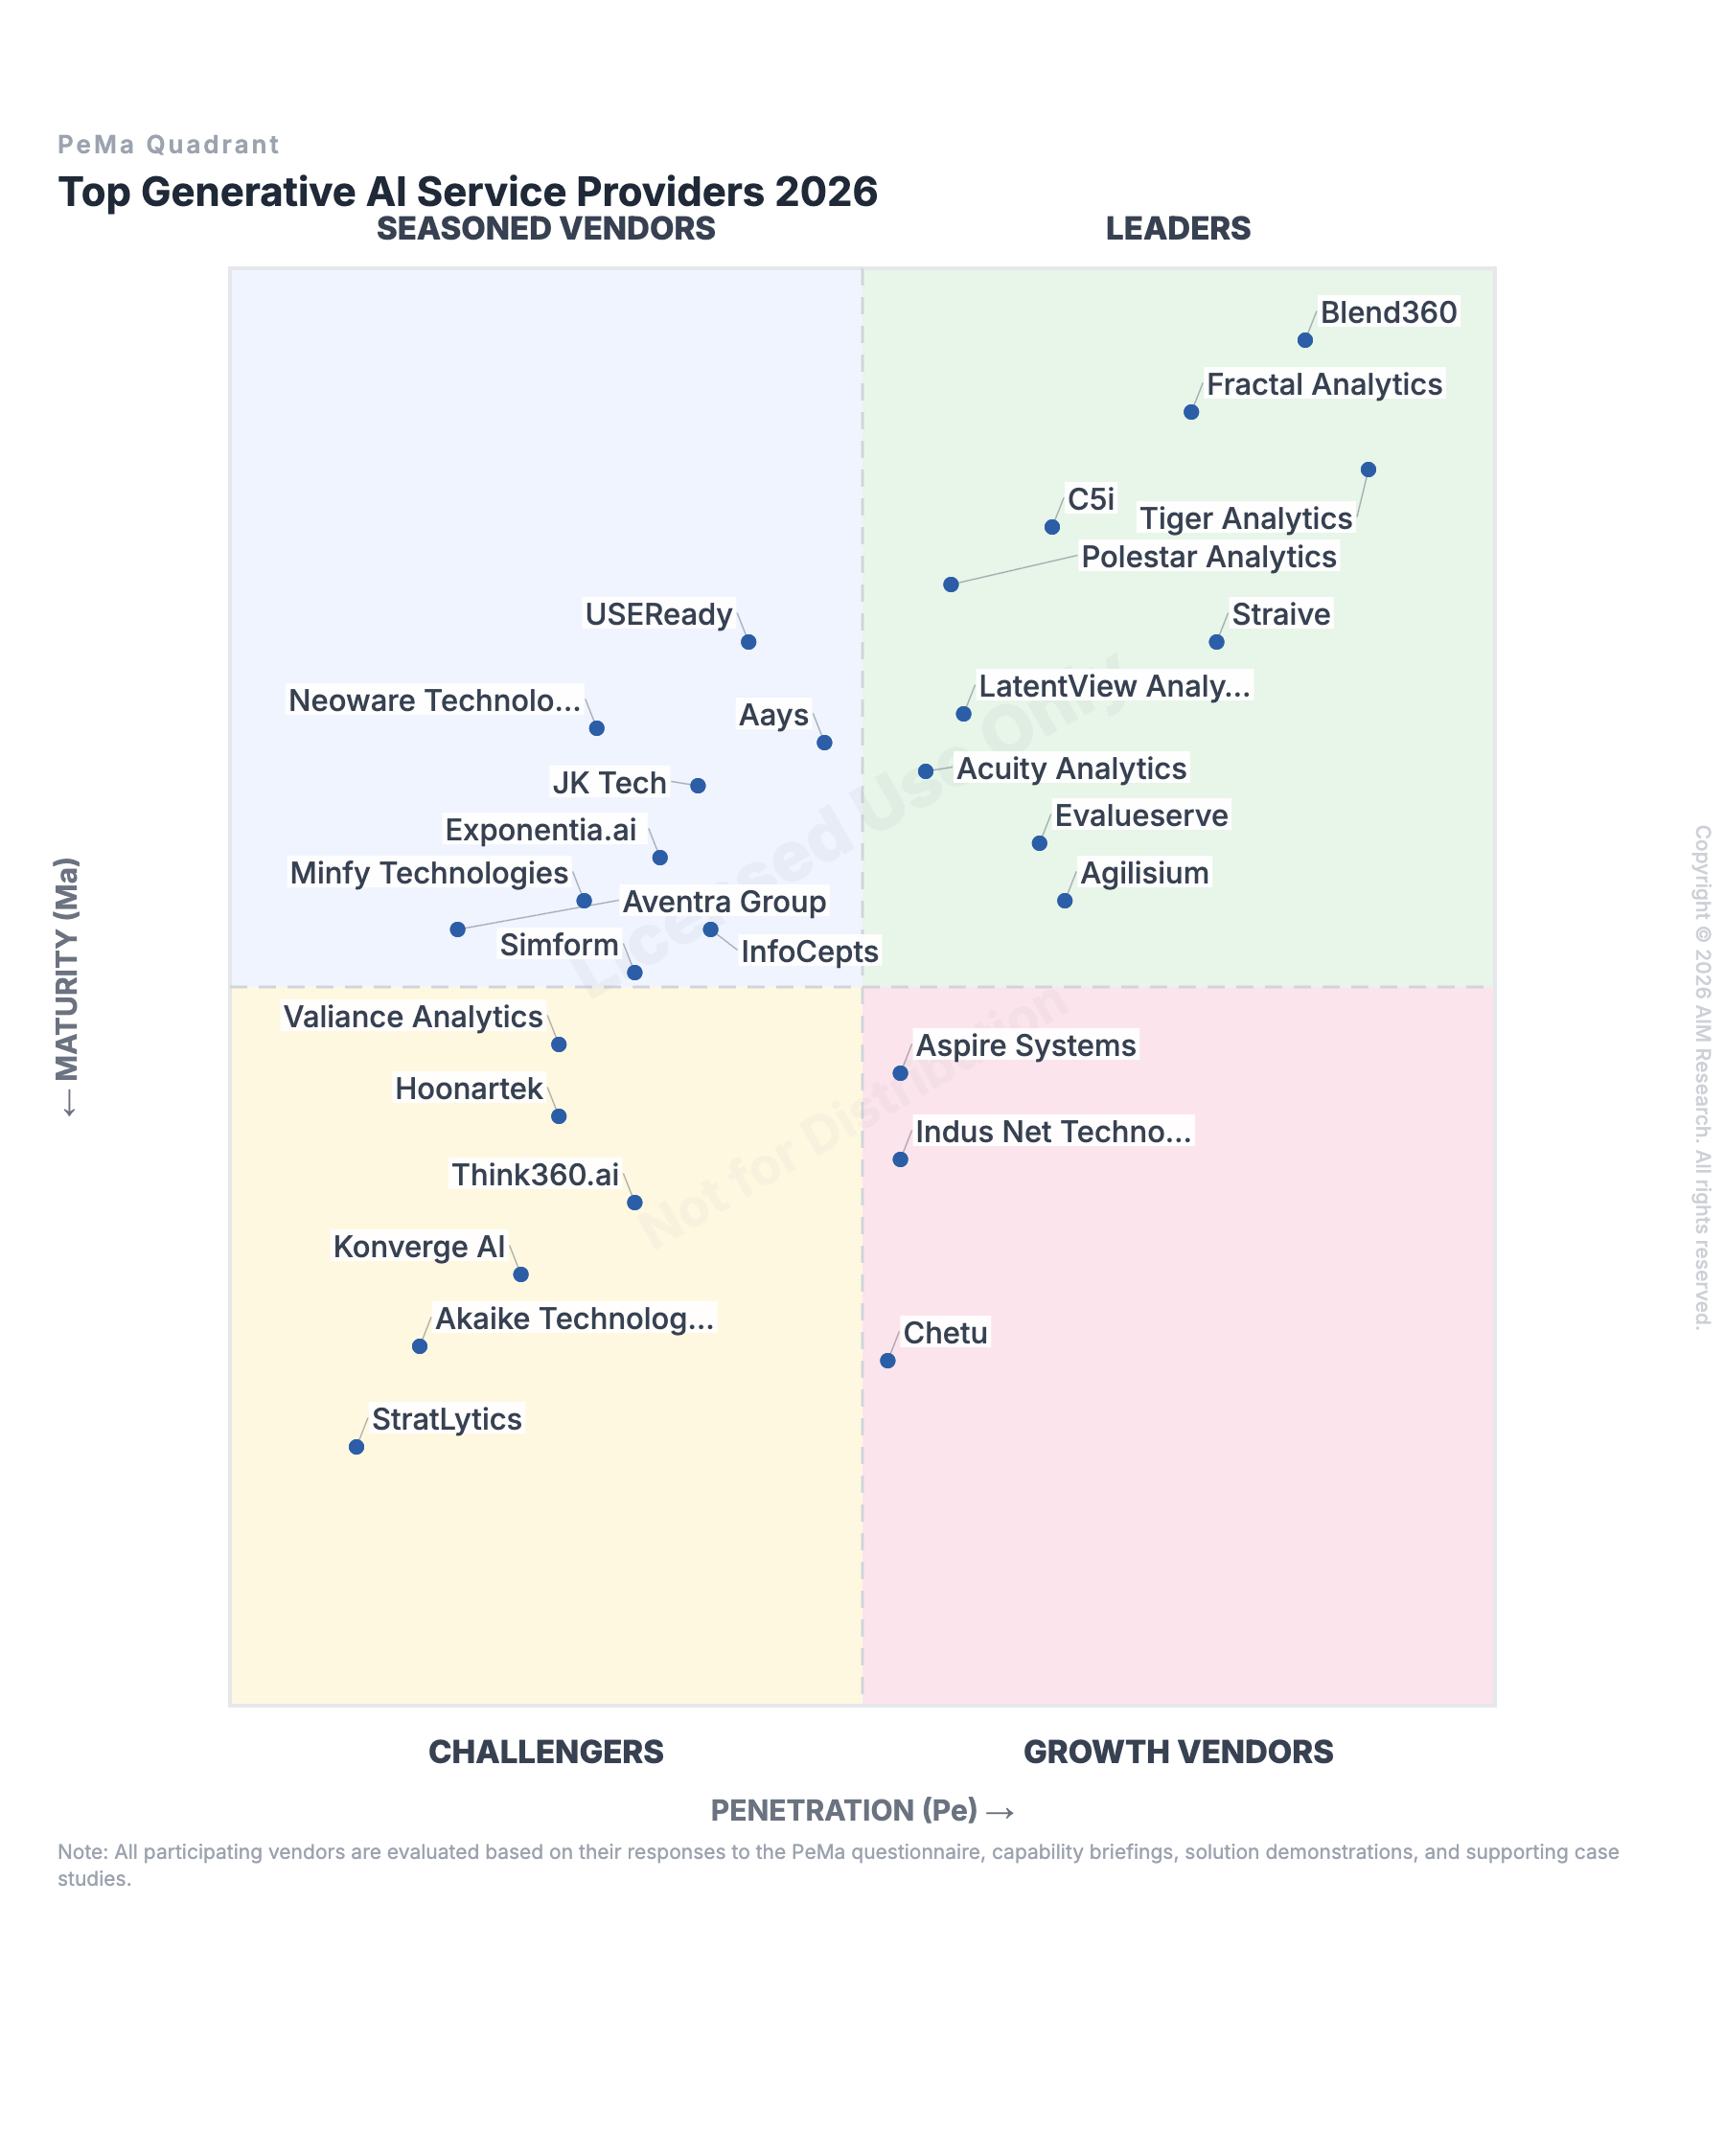
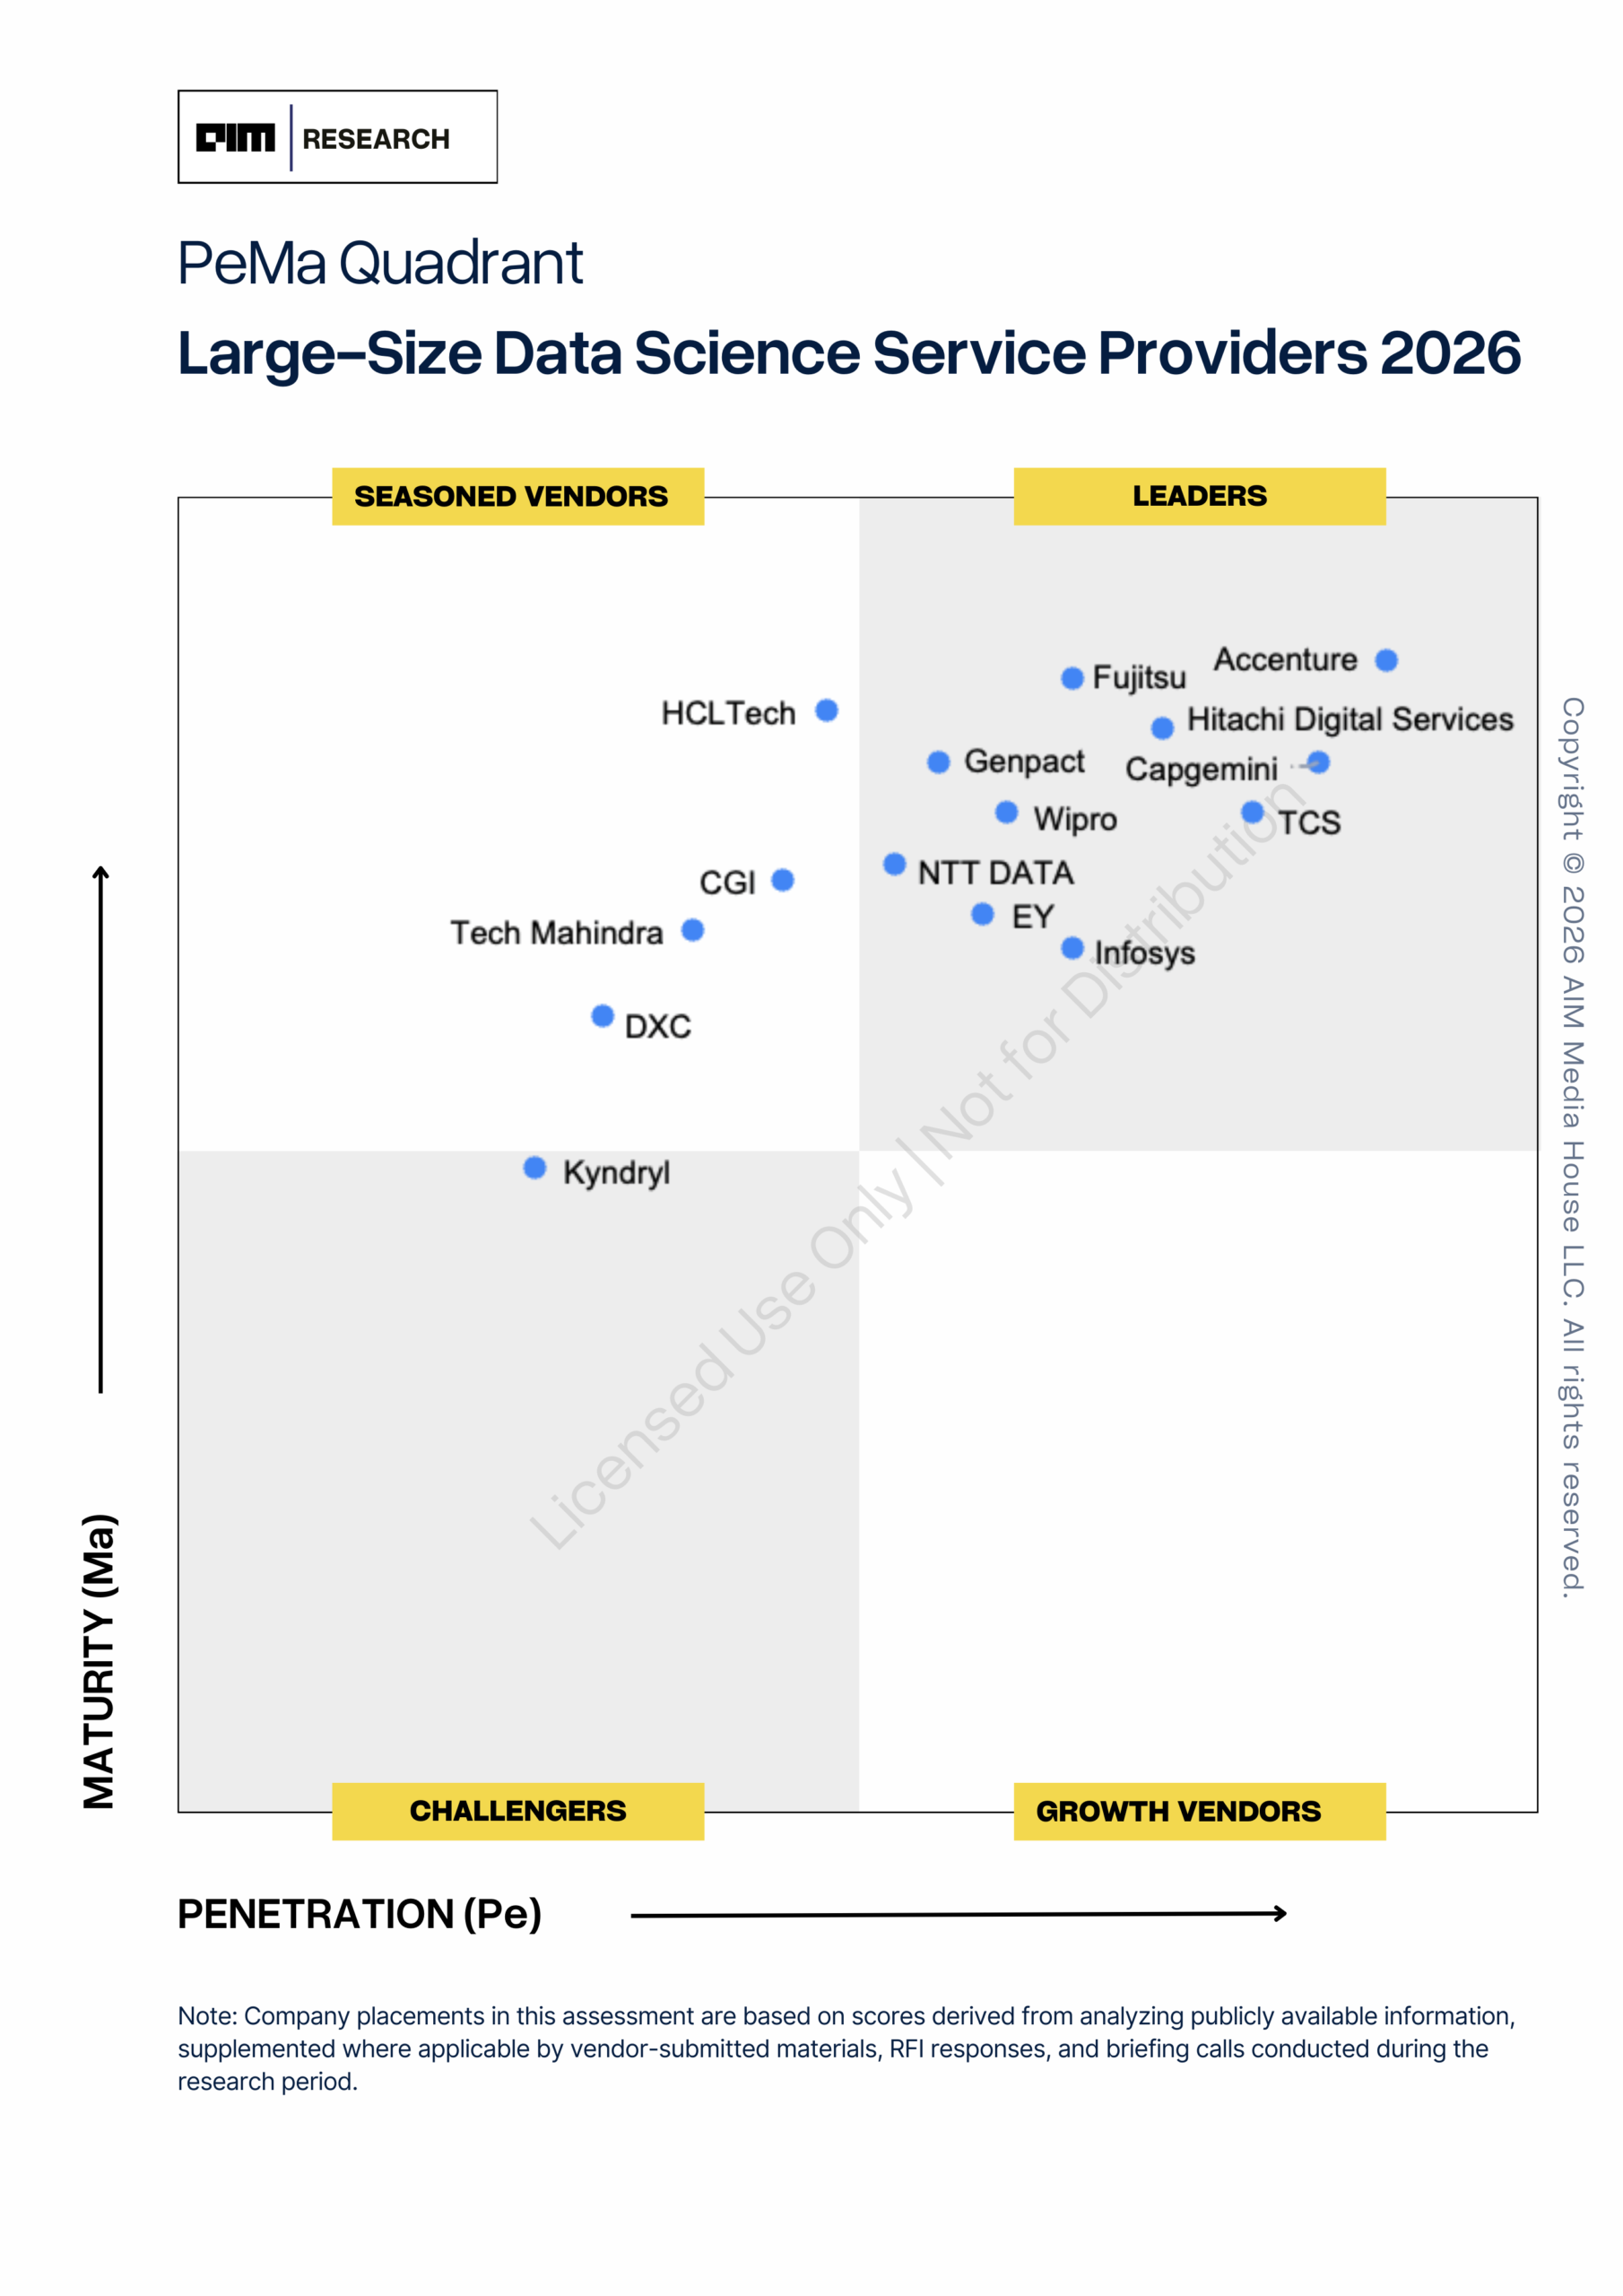
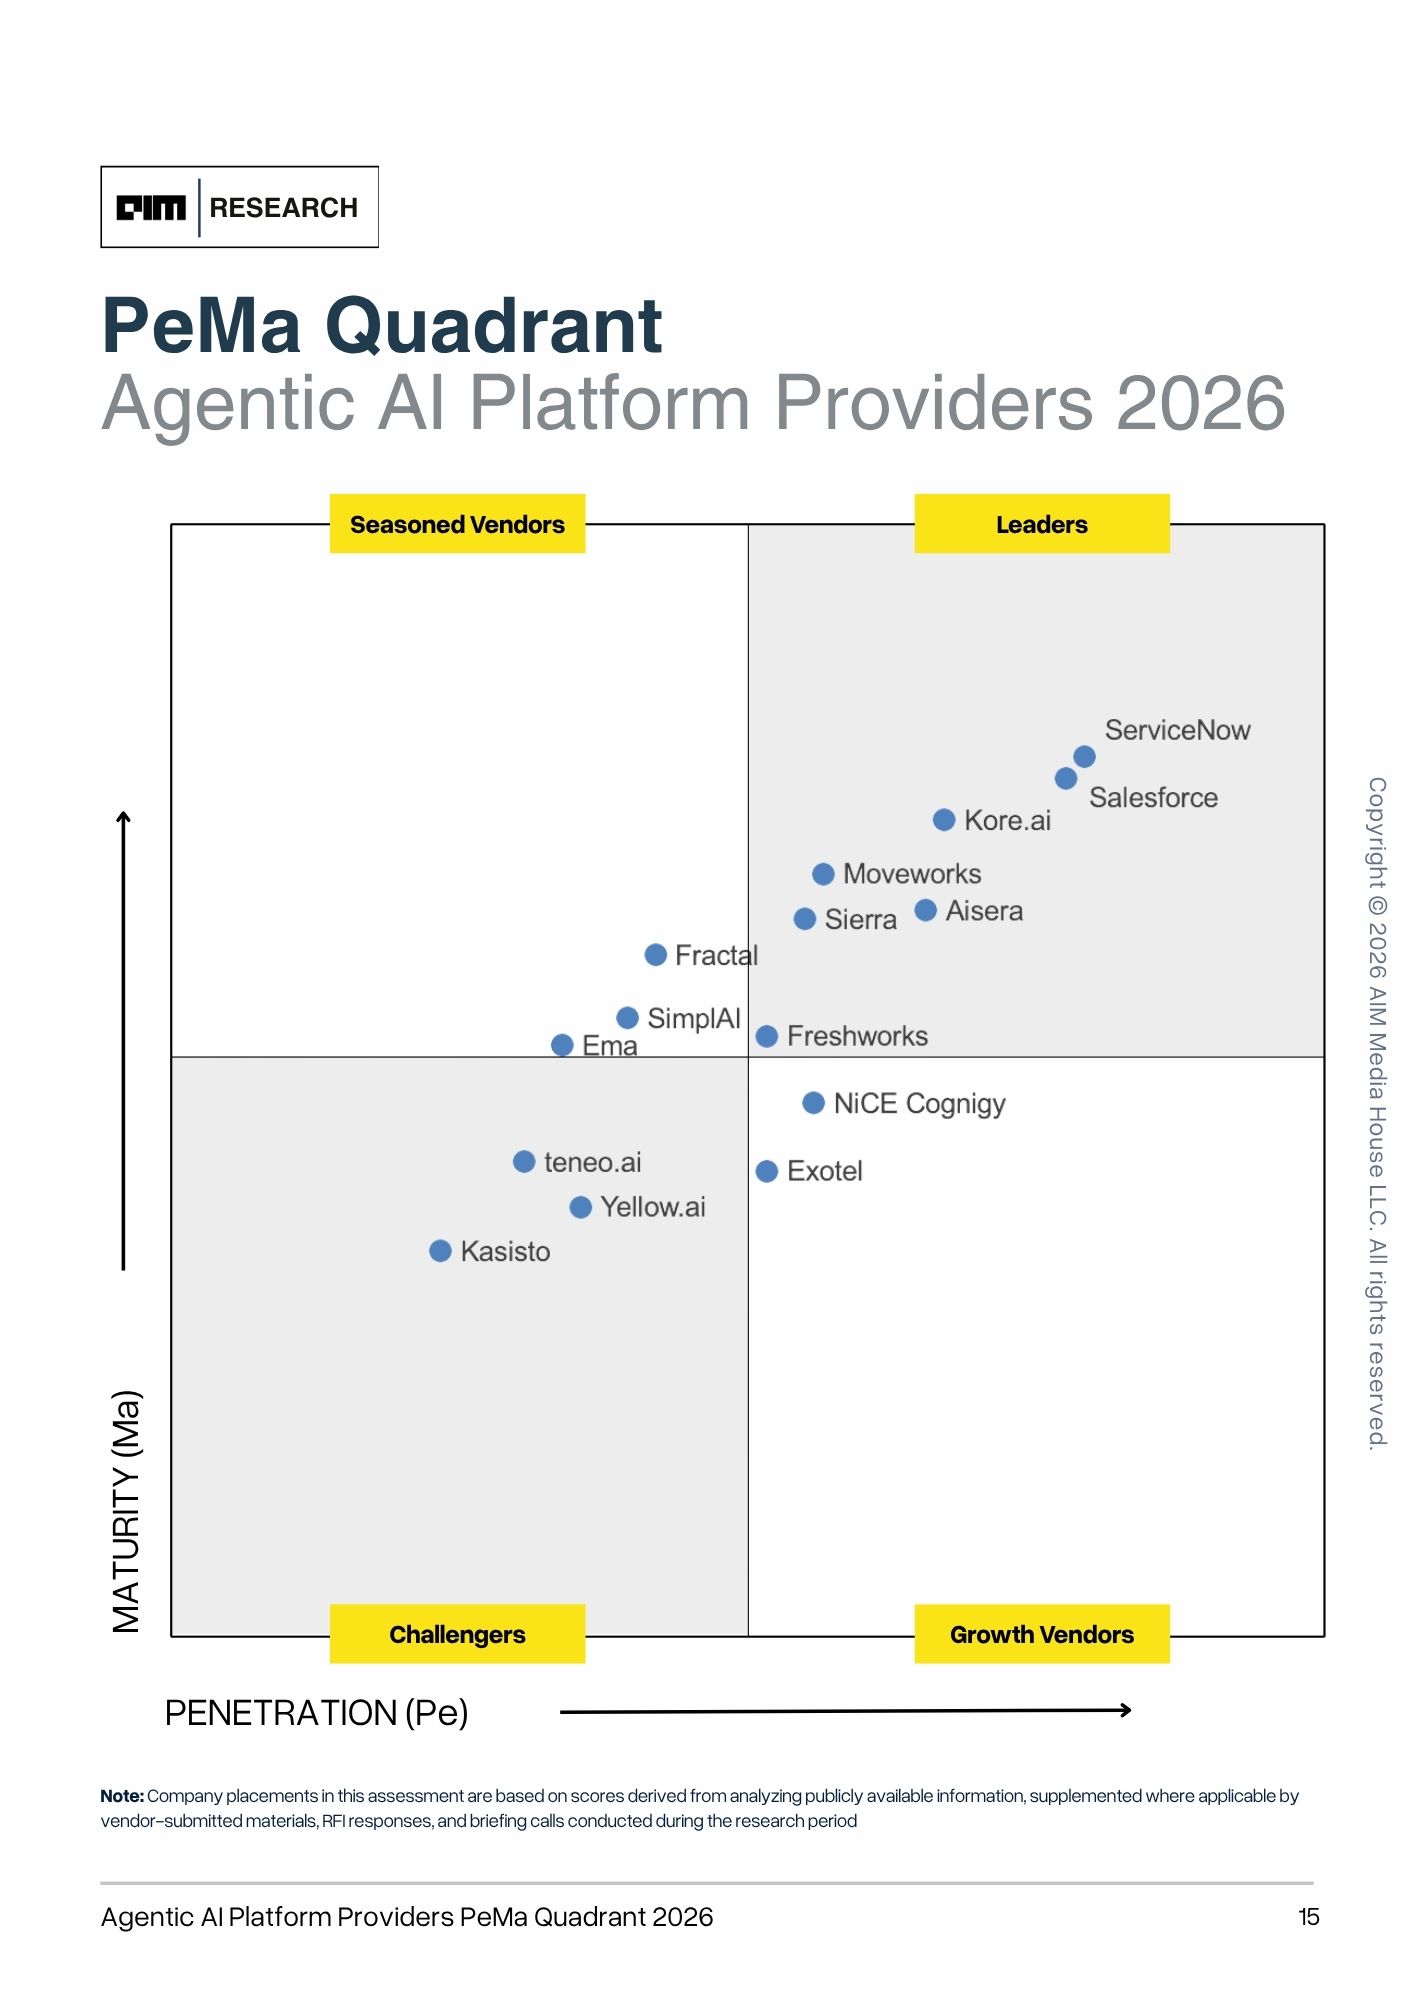
    The Data + AI Platform Providers PeMa Quadrant 2026 provides an independent assessment of one of the fastest-evolving segments of enterprise technology. Drawing on primary and secondary research, the report evaluates 16 participating vendors, examines the market trends and architectural shifts shaping modern Data + AI platforms, and presents a reference framework for assessing enterprise platform capabilities. It positions participating vendors within the 2026 PeMa Quadrant and provides detailed platform profiles covering each vendor’s architecture, capabilities, strengths, and strategic differentiation.Participating platform providers are evaluated across two dimensions. Market Penetration (Pe) measures commercial strength through enterprise adoption, customer traction, ecosystem development, geographic reach, and overall market momentum. Technology Maturity (Ma) assesses the completeness and sophistication of the platform architecture, including AI readiness, governance capabilities, scalability, openness, interoperability, operational maturity, and innovation. Rather than evaluating platforms solely on the breadth of individual capabilities, the PeMa methodology assesses how effectively each platform enables enterprises to operationalize trusted data, advanced analytics, and AI at enterprise scale.Designed for CIOs, Chief Data Officers, Chief AI Officers, enterprise architects, platform engineering leaders, and technology decision-makers, the report offers independent market intelligence and platform benchmarking to support informed technology strategy and platform investment decisions.

    Read More

    Whitepaper

    9

    Market Report

    13
    Global Capability Centers (GCCs) Salary Trends in India 2026 — Market Report cover
    Market ReportMar 2026

    Global Capability Centers (GCCs) Salary Trends in India 2026

    India’s Global Capability Centres have transitioned from cost arbitrage operations to high value innovation hubs, and compensation trends increasingly reflect this shift. GCCs continue to command a clear and widening premium over non GCC employers, reinforcing their positioning as preferred destinations for high quality talent.Compensation within GCCs is shaped by multiple structural factors. Experience remains the most significant driver, with clear differentiation across career stages and a notable inflection in mid career roles. Sector dynamics further influence pay levels, with certain industries consistently commanding higher compensation due to the complexity and strategic nature of work. Geographic location introduces another layer of variation, with leading metros offering higher pay while emerging hubs operate at a relative discount.Role specialisation has emerged as a defining factor in compensation, with advanced and niche technology roles attracting a premium over generalist positions. Beyond technology, non tech roles also exhibit varied compensation patterns, with only a subset of functions consistently outperforming the median. Educational qualifications further shape pay outcomes, with higher academic attainment translating into stronger compensation differentiation across both tech and non tech talent pools.Overall, these trends provide a comprehensive view of how compensation is evolving within India’s GCC ecosystem, offering valuable insights for GCC leaders, talent strategists, and industry stakeholders.

    Read More
    MarketView on Graph Databases — Market Report cover
    Market ReportJan 2026

    MarketView on Graph Databases

    This Marketview provides a comprehensive assessment of the graph database ecosystem, covering 30 graph database vendors and the solutions they offer. The report evaluates vendor differentiation across core graph engines, analytics and AI capabilities, scalability and deployment models, developer tooling, and platform extensibility. Particular attention is given to the growing convergence of graph databases with AI, including the adoption of graph-enabled retrieval architectures (GraphRAG), which are expanding at a materially faster pace than the overall graph database market.The report also analyzes enterprise adoption across key industries, with strong traction observed in financial services, cybersecurity, life sciences, telecom, retail, and manufacturing.Graph databases are being deployed for high-impact use cases such as fraud detection, threat intelligence, customer and entity resolution, enterprise knowledge graphs, supply- chain intelligence, and AI-powered search and reasoning. Case evidence from production deployments demonstrates that graph databases are increasingly moving beyond experimentation into mission-critical systems.In addition to technology and use-case analysis, the Marketview examines commercial and deployment models across the vendor landscape, including open-source and open-core offerings, subscription licensing, and fully managed cloud services. By combining market sizing, growth outlook, technology trends, vendor profiling, and buyer considerations, this report is intended to support CXOs, enterprise architects, data leaders, and investors in understanding the evolving graph database market and making informed technology and partnership decisions.
    Read More

    Looking for the right vendor?

    Submit your RFP and we'll match it to qualified vendors from our evaluated network.

    Submit RFP